
Automation sets the pace. Engineers set the answer.
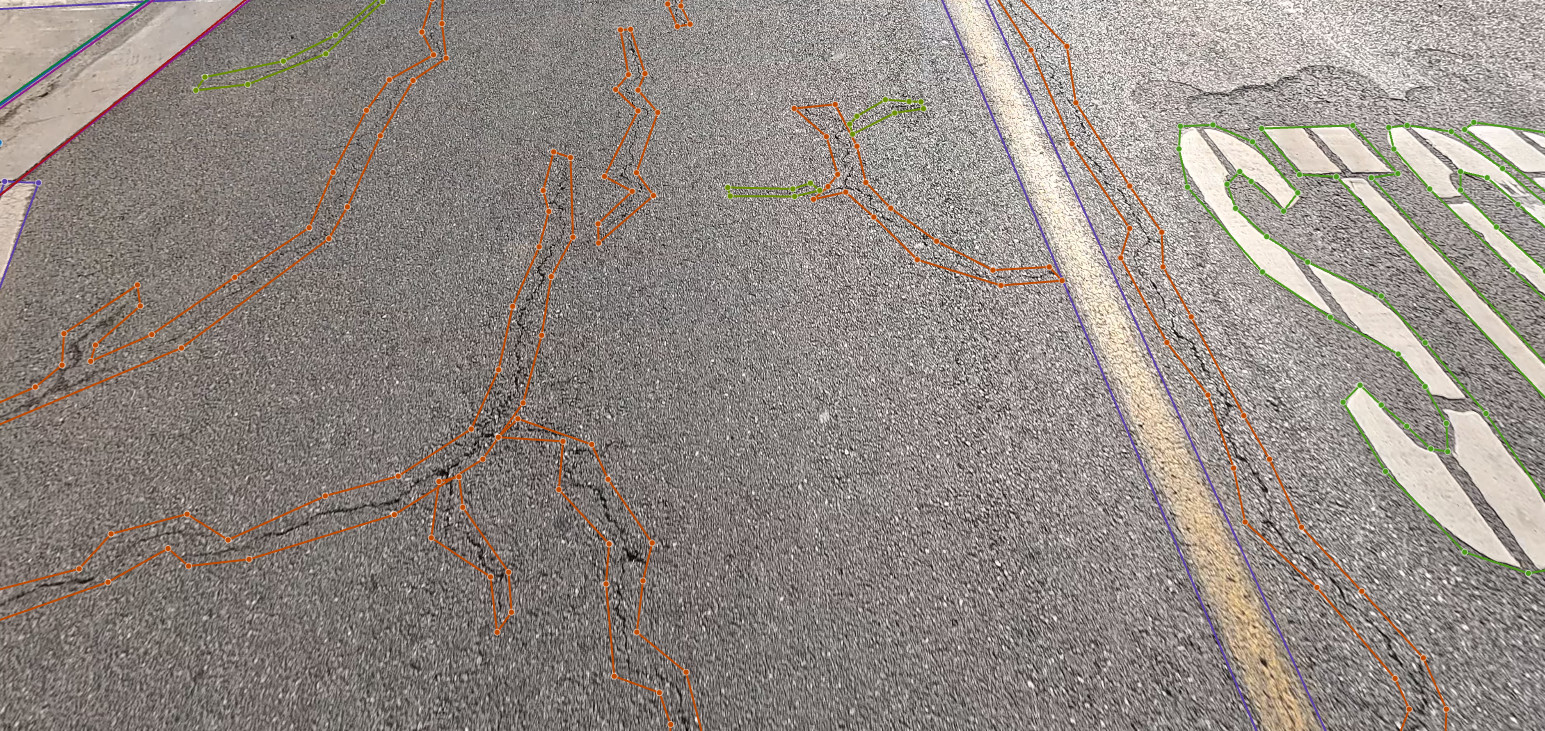
The CIS Mobile Mapping Solution images 100% of every street at posted speed. Our models outline every distress and roadside asset, and an analyst confirms each one in SAMS Studio before it reaches a PCI or your GIS.
From the first lane-mile to a verified dataset.
Drive every lane
A dedicated pass in each travel and turn lane, against a lane-mile plan you approve. A geotagged frame every 15 to 25 feet.
Detect with AI
Models classify the surface, then detect and measure ASTM D6433 distresses and their severity on every image.
Verify in SAMS Studio
Analysts review each detection, fix edge cases and sign off. Automation sets the pace; people set the answer.
Deliver to your GIS
PCI, distresses, treatments and image links in your geodatabase, in SAMS and in PAVER if you use it.
Continuous measurement, not sampling.
Our vehicle captures continuous 4K downward pavement imagery, forward right-of-way imagery and 360° imagery at posted speed. Nothing is sampled and nothing is rated from a windshield.
- Written collection protocol: dry pavement, daylight, no debris cover
- Any section that fails the protocol is re-driven at our cost
- Daily uploads feed a coverage dashboard you can watch
- A no-cost pilot on a few miles before production
Every detection reviewed before you see it.
SAMS Studio is the QC workspace where our analysts review AI detections frame by frame, beside the map of the route. The distress mask shows each crack and area by type and confidence; analysts correct, approve and sign off before the PCI is computed.
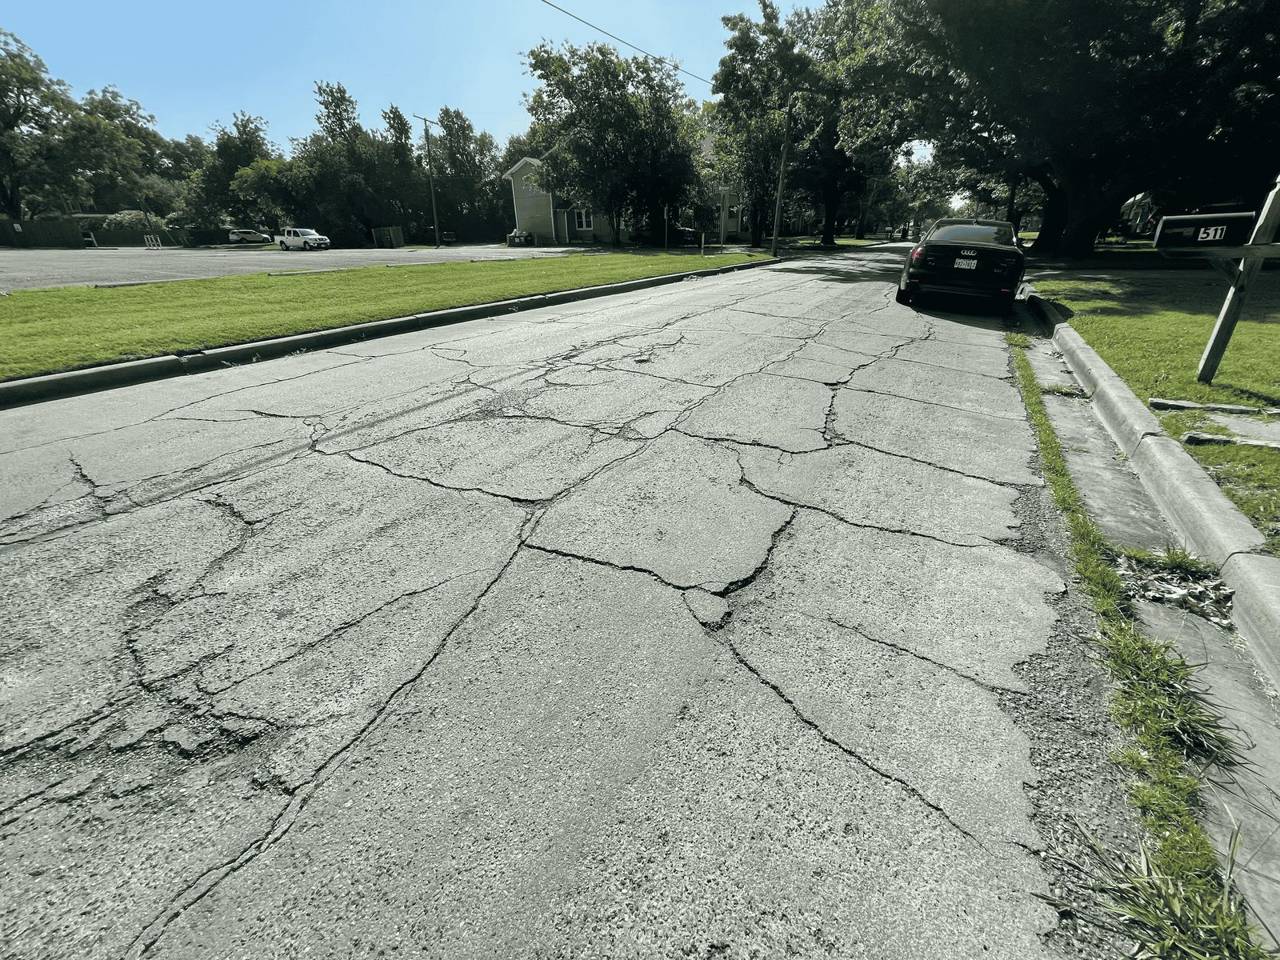
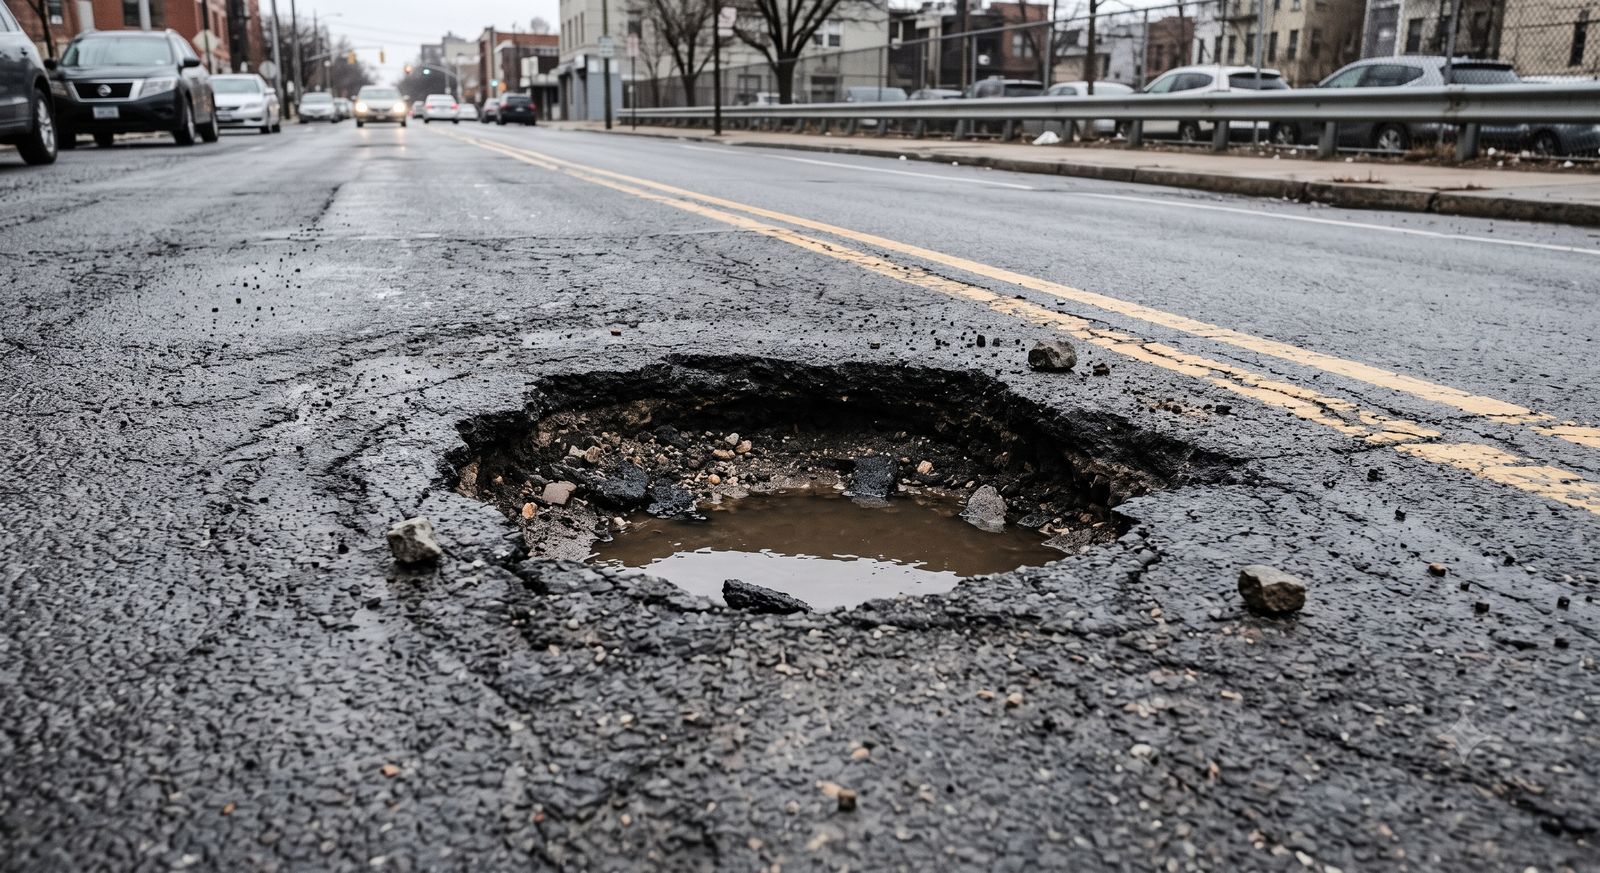
- Alligator, block, longitudinal and transverse cracking, patching, potholes, raveling and weathering
- Severity levels to ASTM D6433, or your agency's protocol
- Each distress linked to its image and location
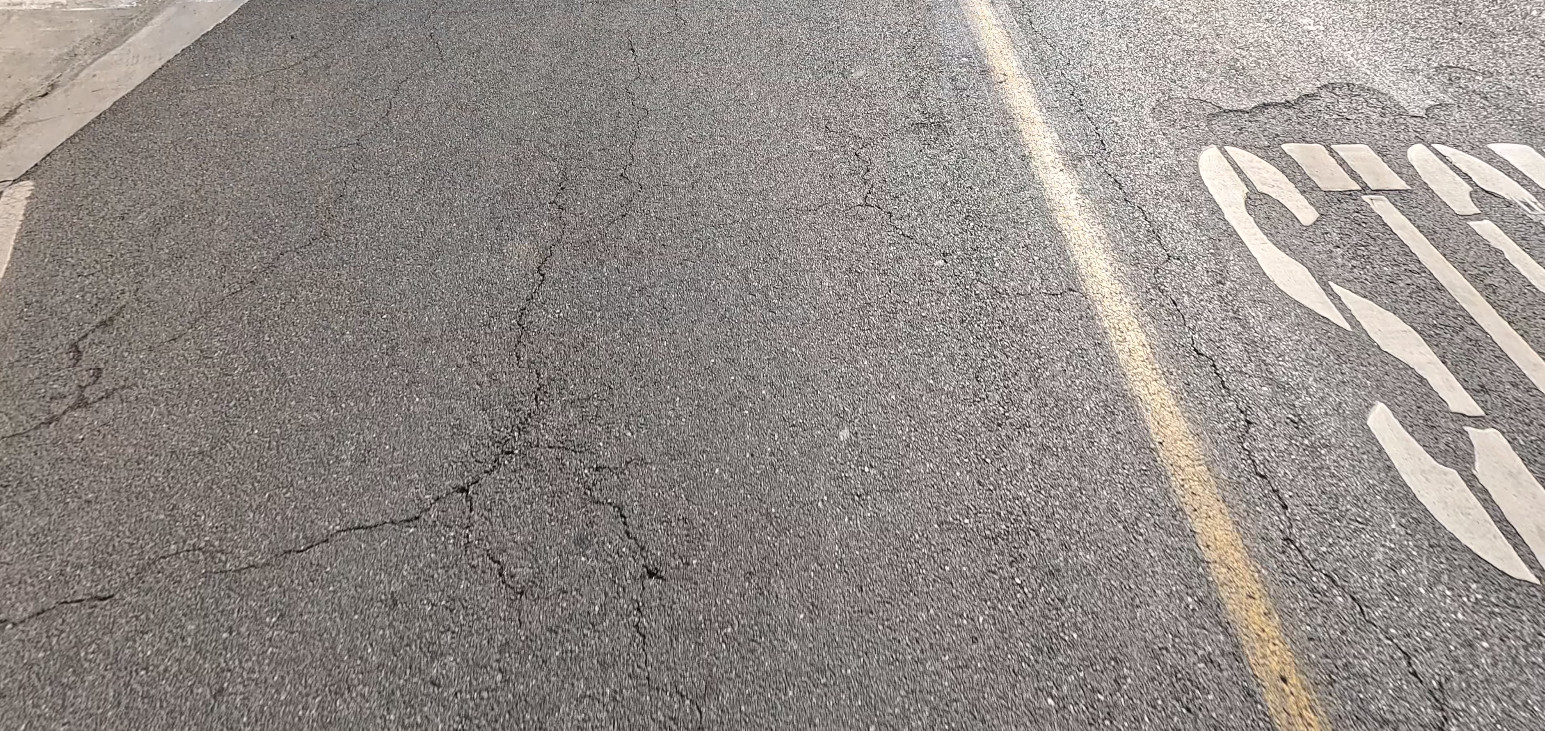 Survey frameSAMS Studio · distress mask
True IRI and a 3D point cloud from the same drive.
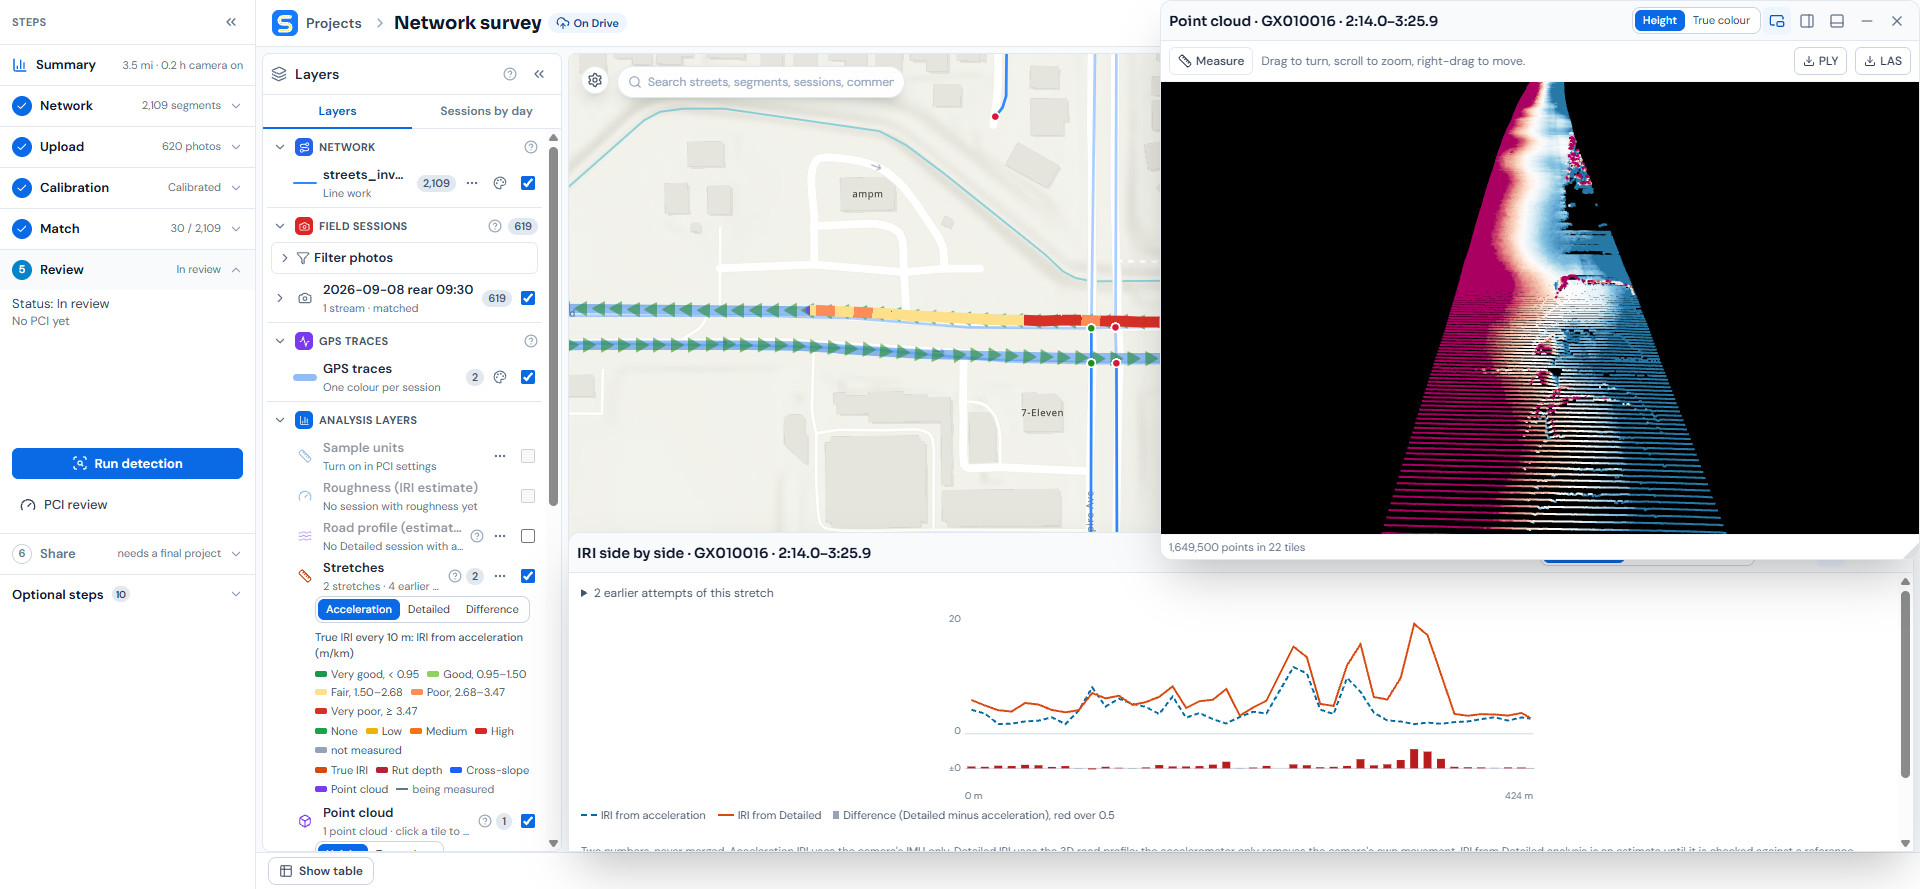
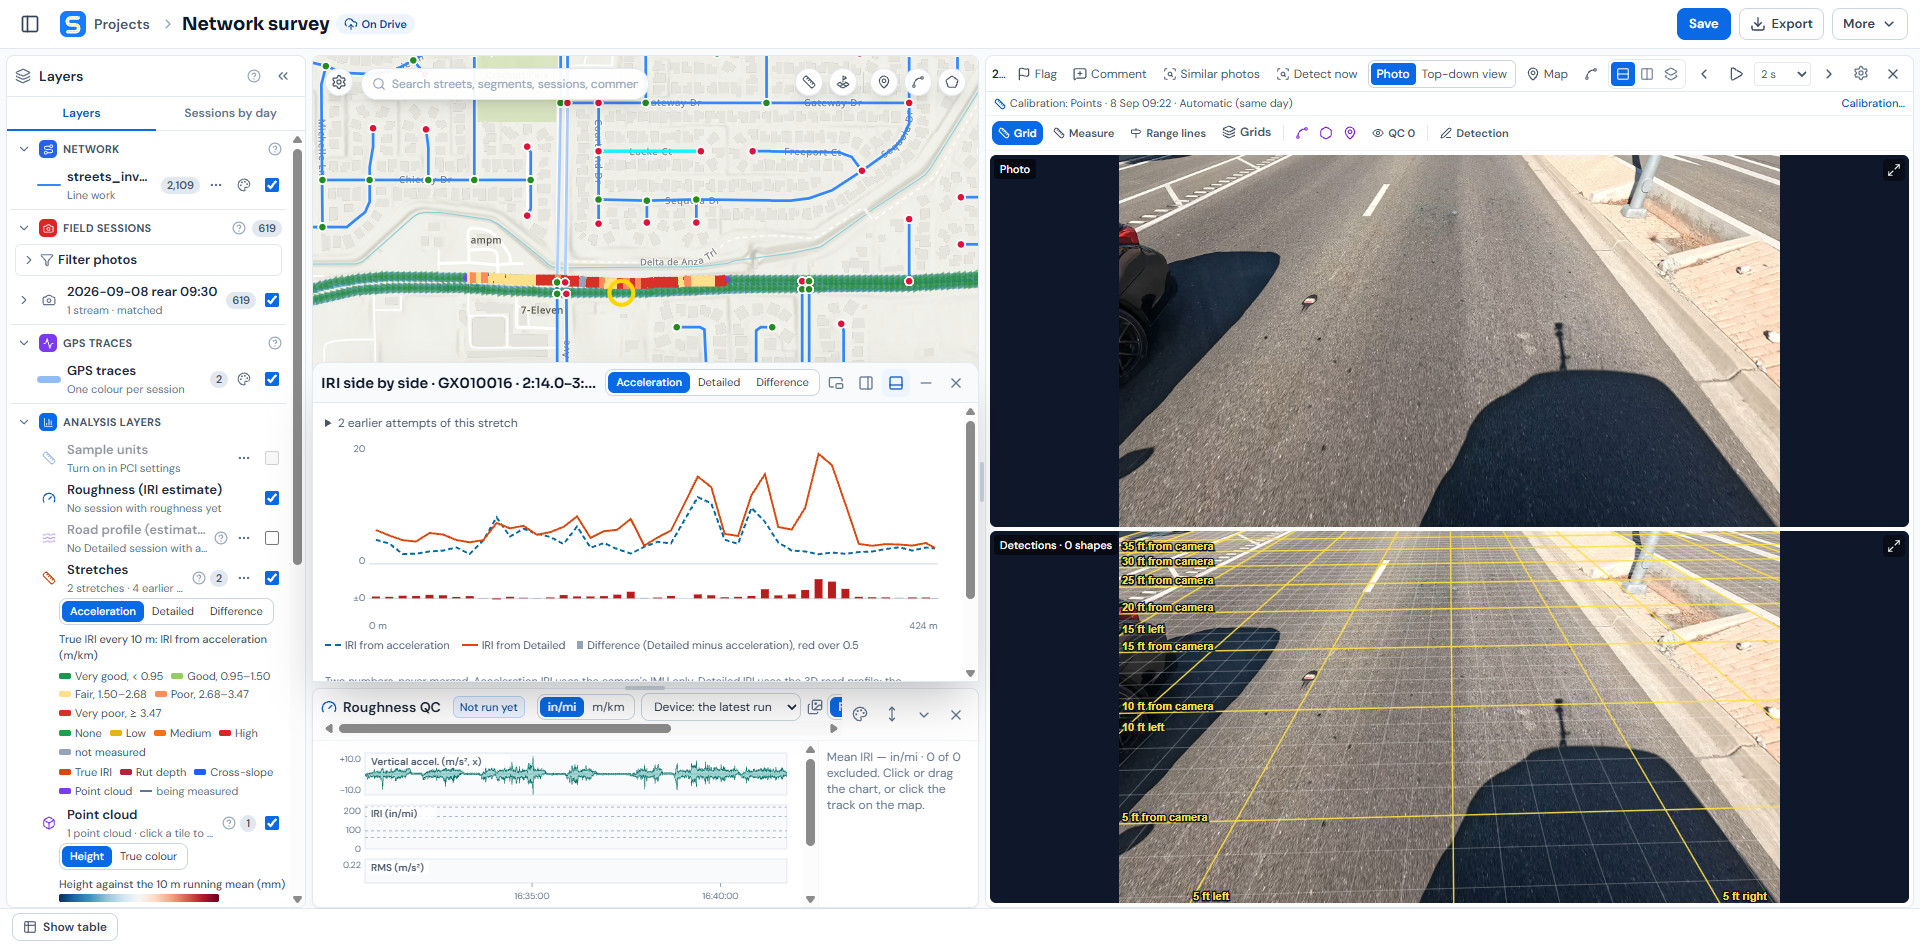
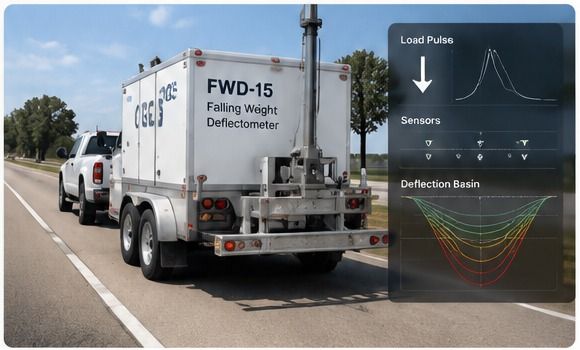
Studio measures roughness along every stretch it drives and colors the road by IRI, from very good to very poor. Open a stretch to see its IRI every 10 meters next to the 3D point cloud of the road surface, built from the drive and colored by height.
- True IRI every 10 m, colored on the map
- Rut depth and cross-slope along the stretch
- Point cloud in 3D, with a measuring tool and PLY or LAS export
Photo, map and roughness in one workspace.
Click any point on a stretch and Studio opens that survey photo next to its calibrated top-down grid, with range lines in feet from the camera, the IRI chart for the stretch and the roughness QC trace from the drive. Flag a photo, comment, find similar photos or run detection from the same toolbar.
- Calibrated grid and range lines on every photo
- IRI side by side: from acceleration and from the detailed road profile
- Roughness QC with vertical acceleration, IRI and RMS over time
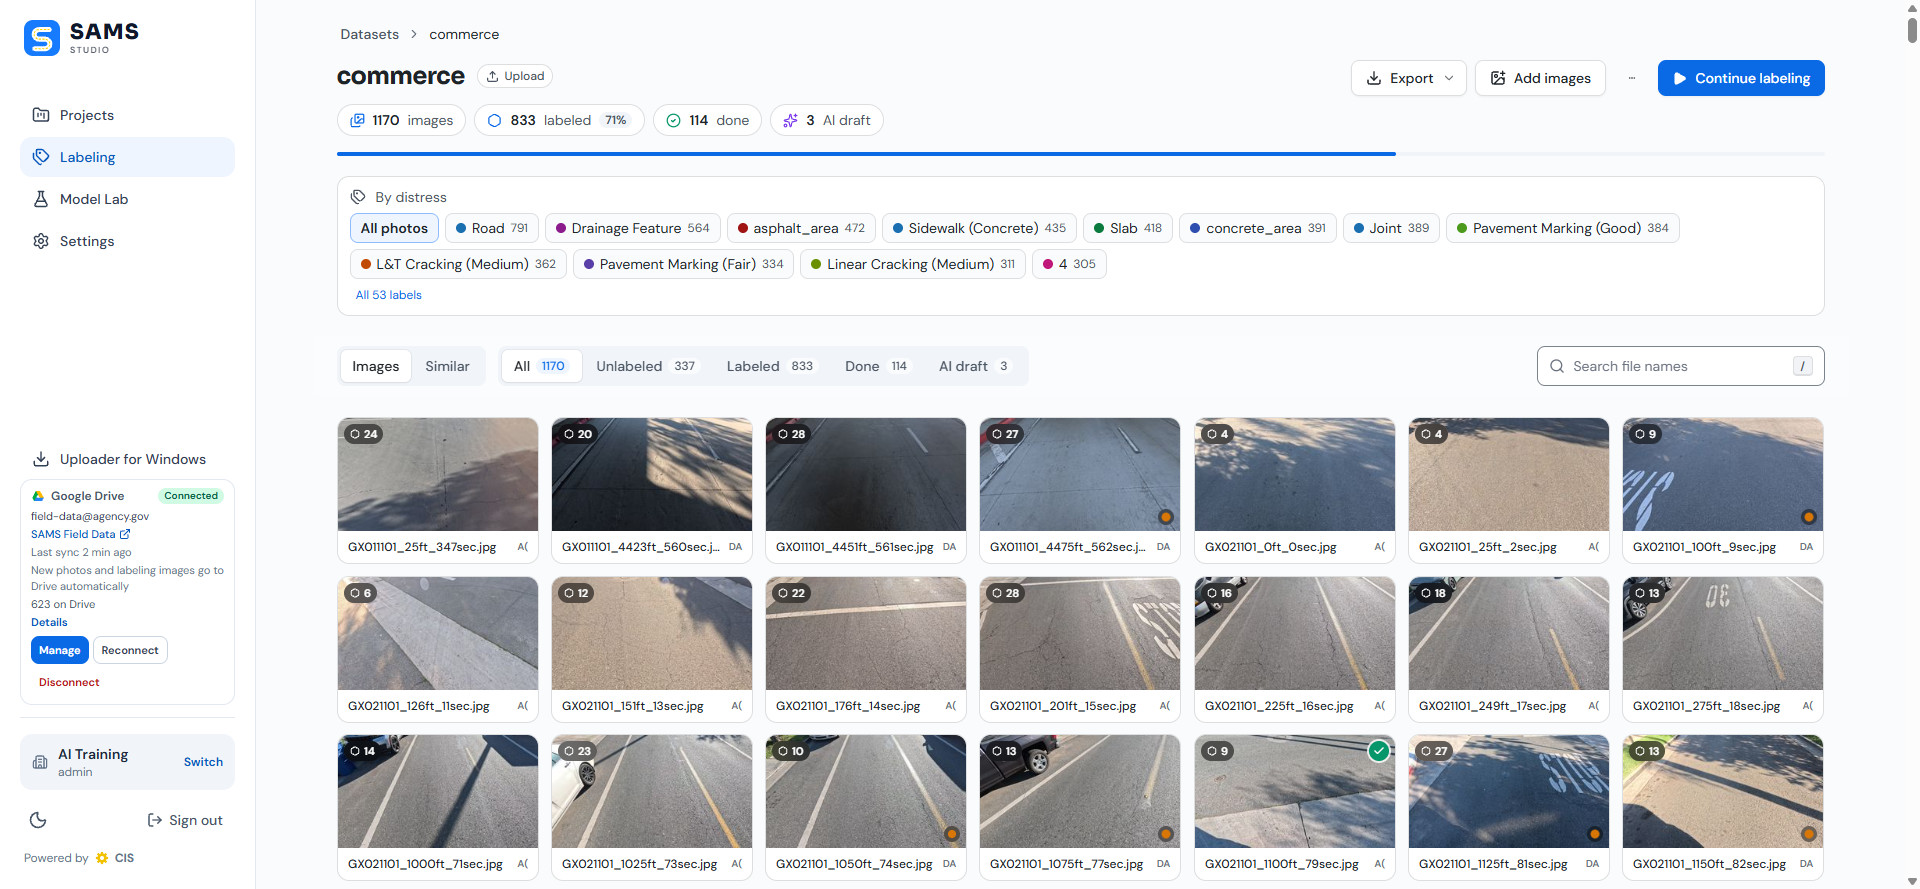
Thousands of frames, reviewed and searchable.
Every survey frame lives in a Studio dataset that you can filter by distress, from alligator, L&T and linear cracking to patching, joints and markings, with a count of how many frames are labeled and checked.
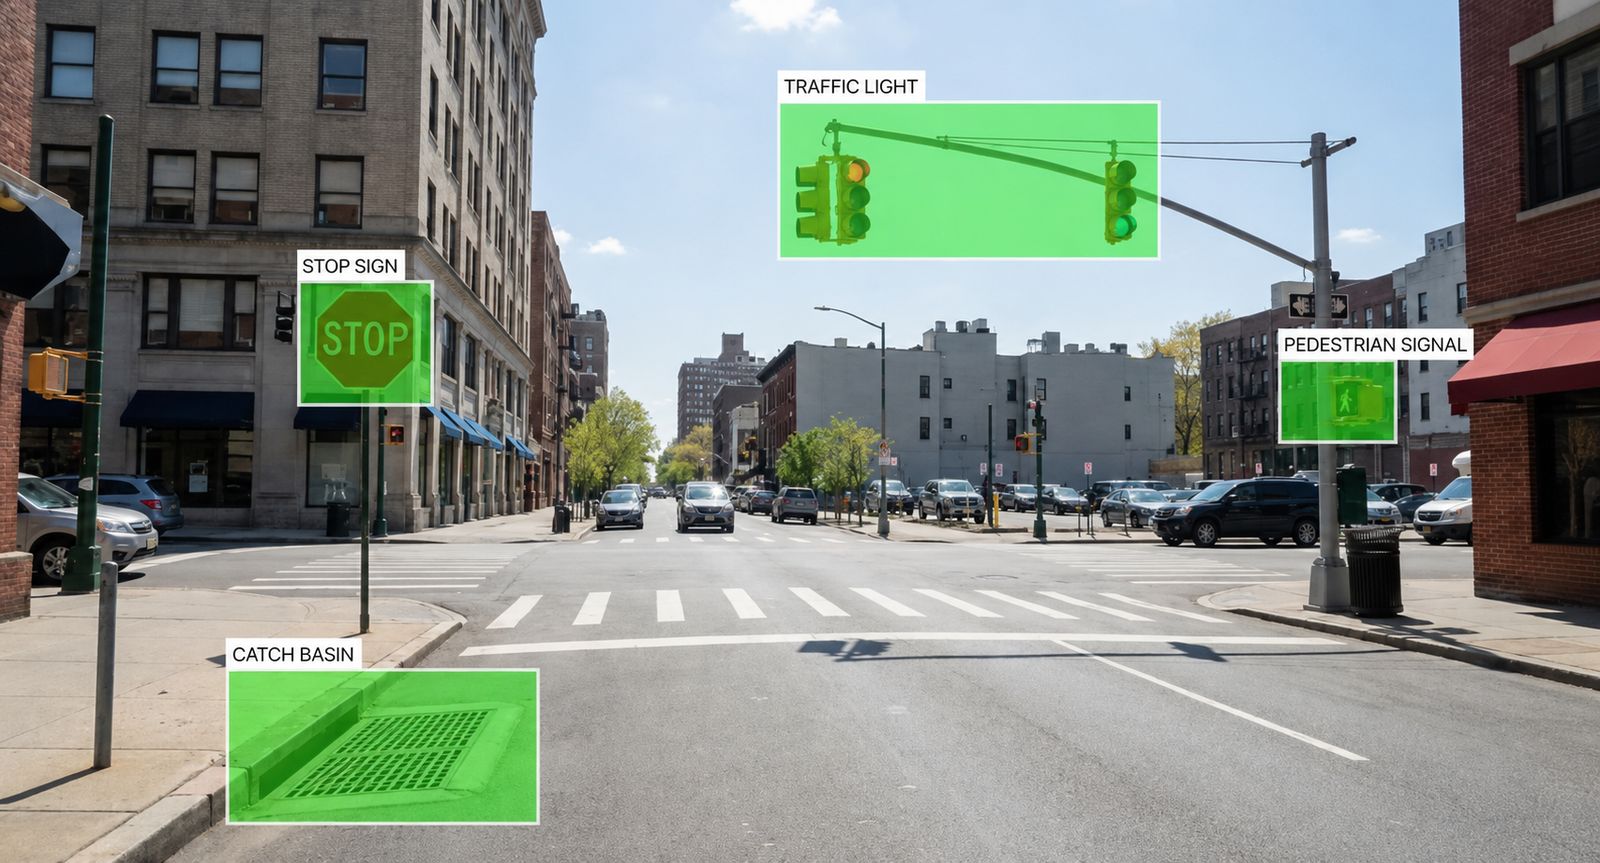
One drive, a full roadside inventory.
Because we image the whole right-of-way, you can add an inventory of roadside assets from the same drive, with no extra field collection. Each asset arrives as a GIS layer with location, type and condition, linked to its image.
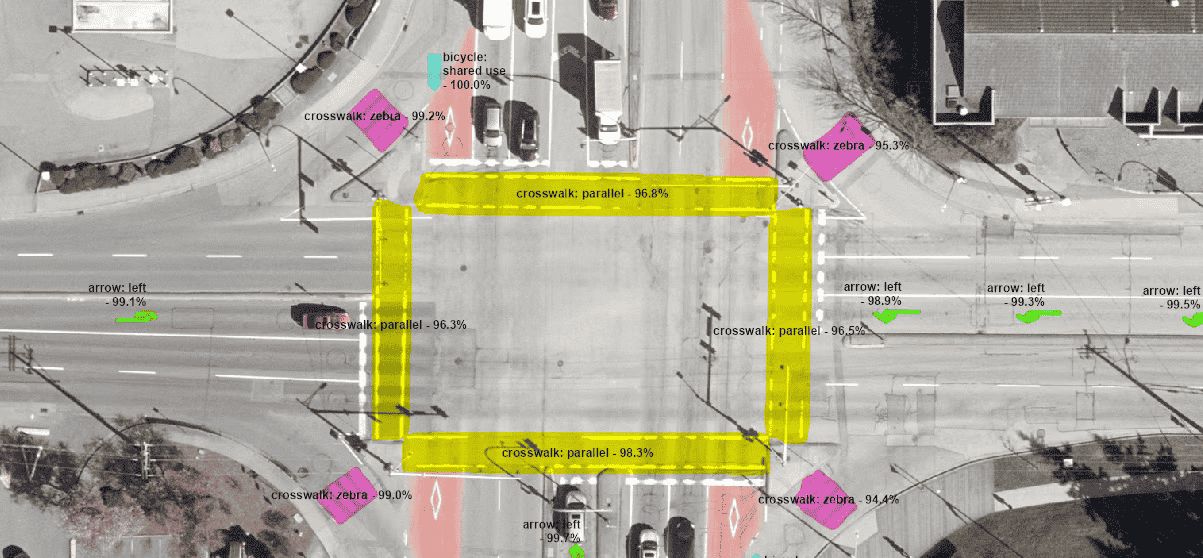
- Markings: striping, crosswalks and maintenance zones
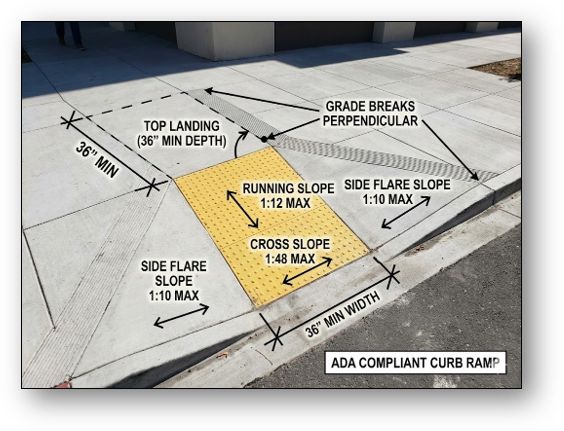
- Curbside: curb and gutter, sidewalks, curb ramps, driveway aprons
- Traffic: signs, signals, streetlights and street furniture
- Utilities and drainage: inlets, manholes and hydrants
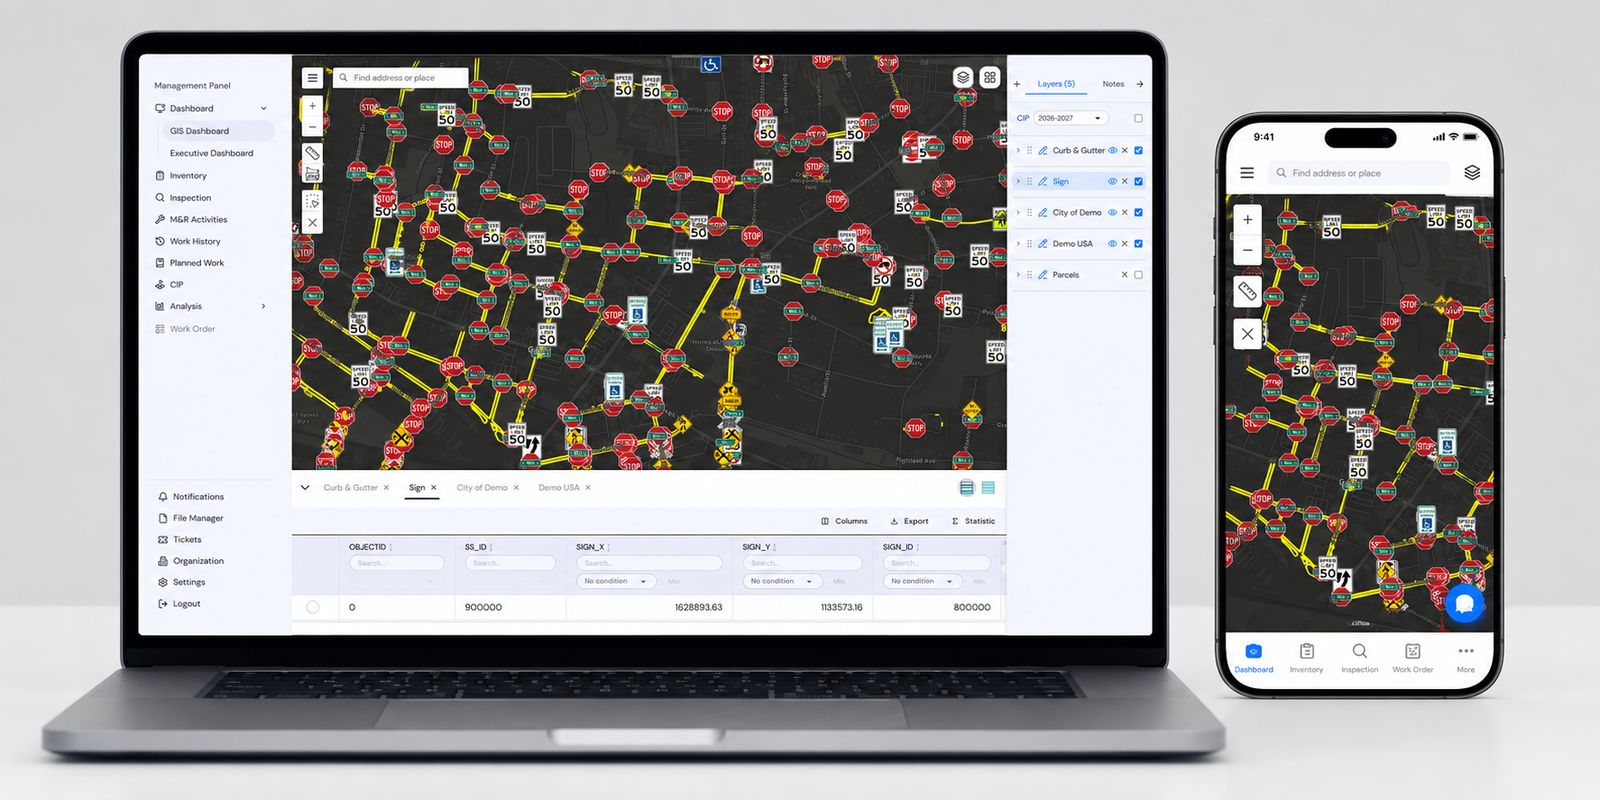
Keep the inventory current between surveys.
Field crews inspect assets, record defects and take photos from a phone or tablet with SAMS Collector. GPS places every record on the map, and the data lands in SAMS without re-entry.
- Forms built from your own asset types
- Photos and GPS on every inspection
- Works with the same map and data as SAMS Core and EAM
See SAMS with your own data.
A 20-minute demo is enough to see the multi-year picture. We reply within one business day.